Data visualisation
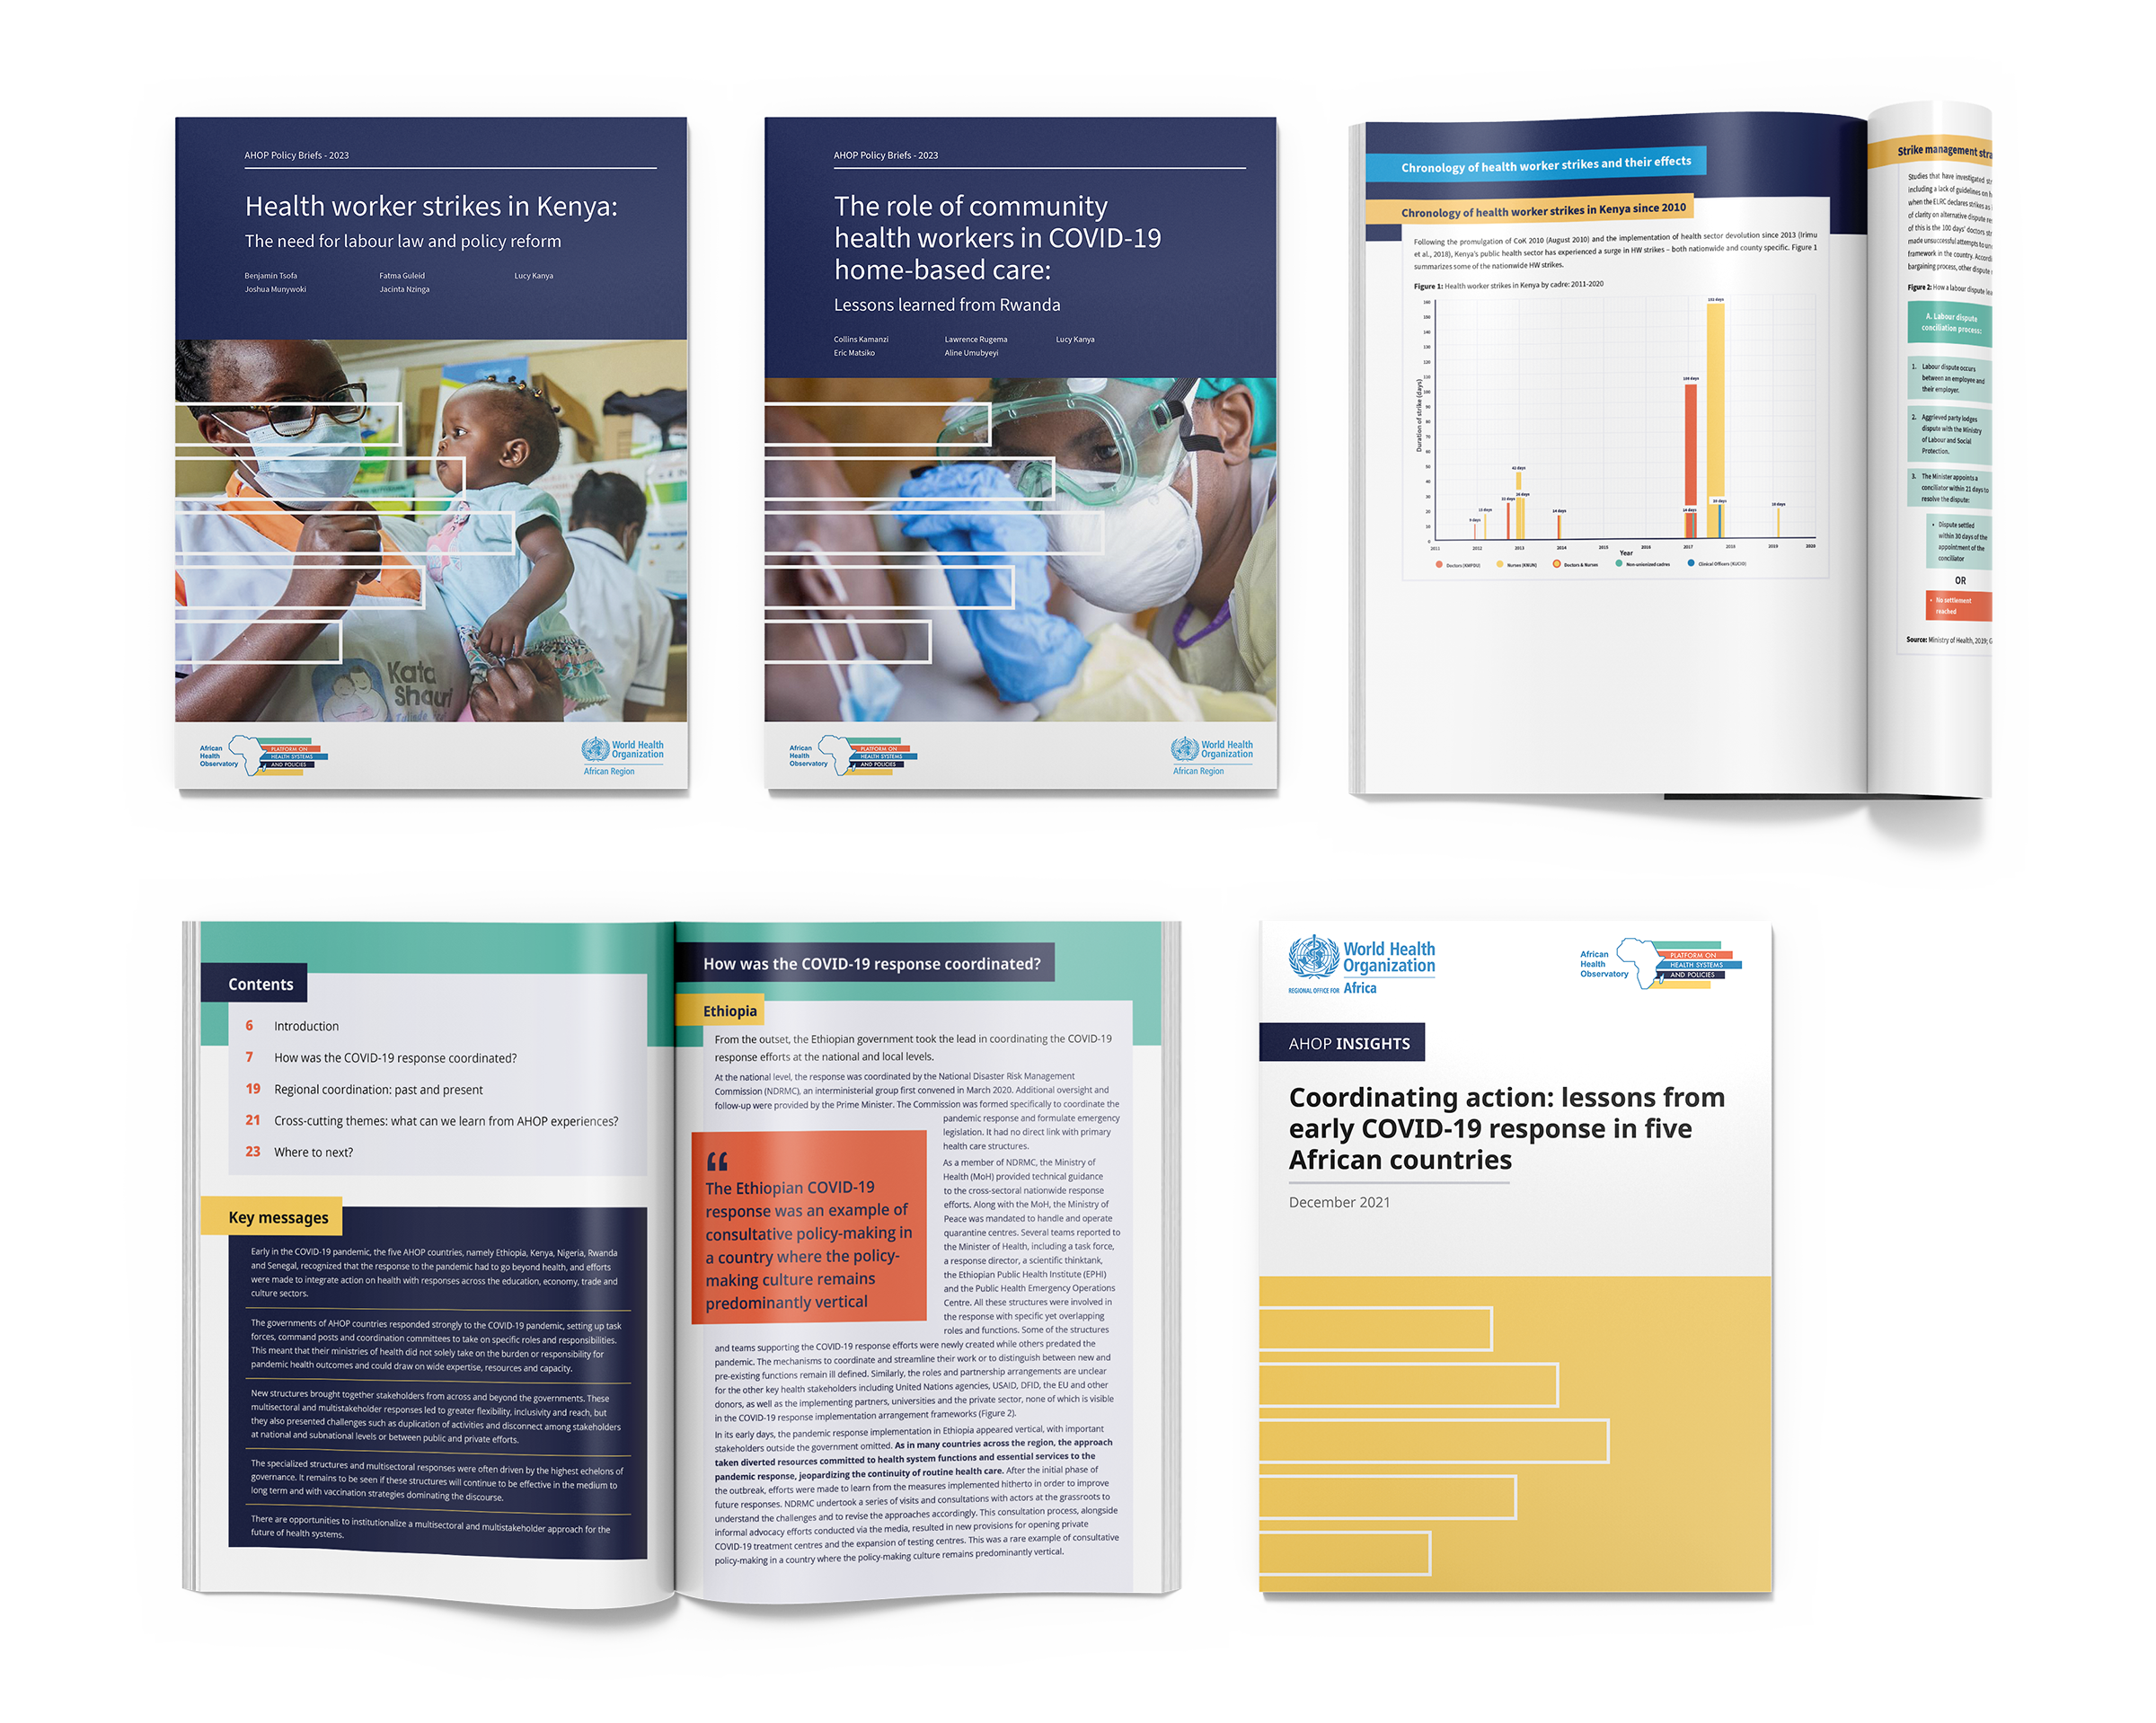
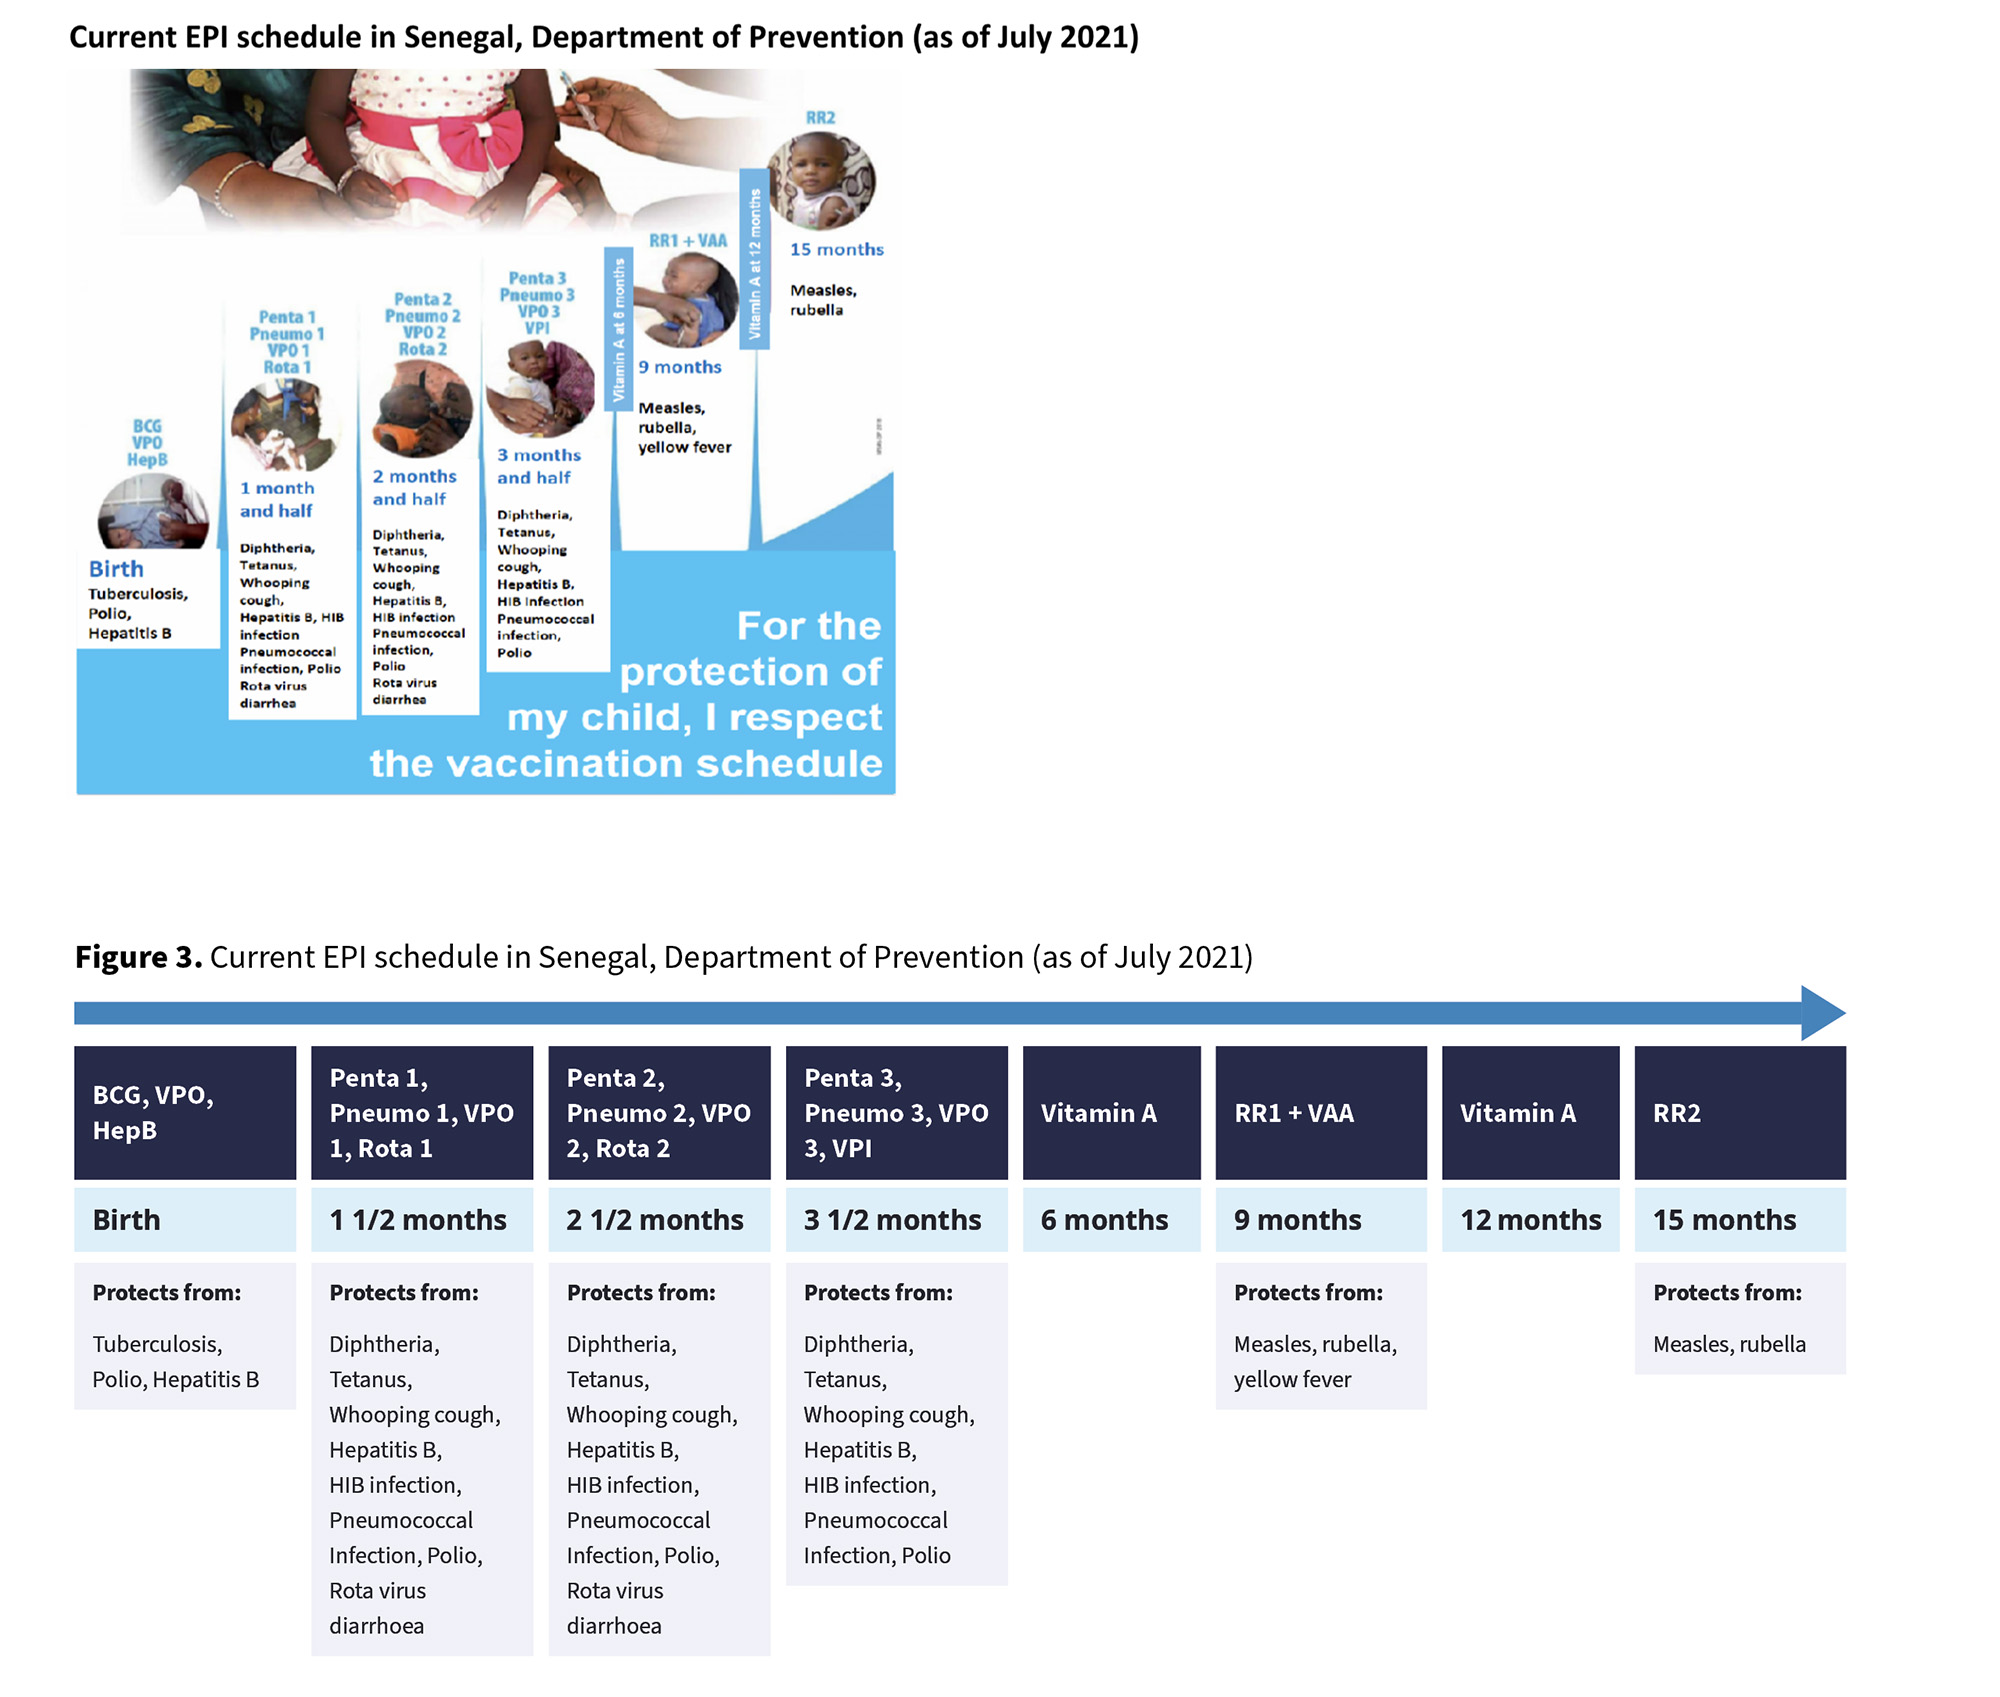
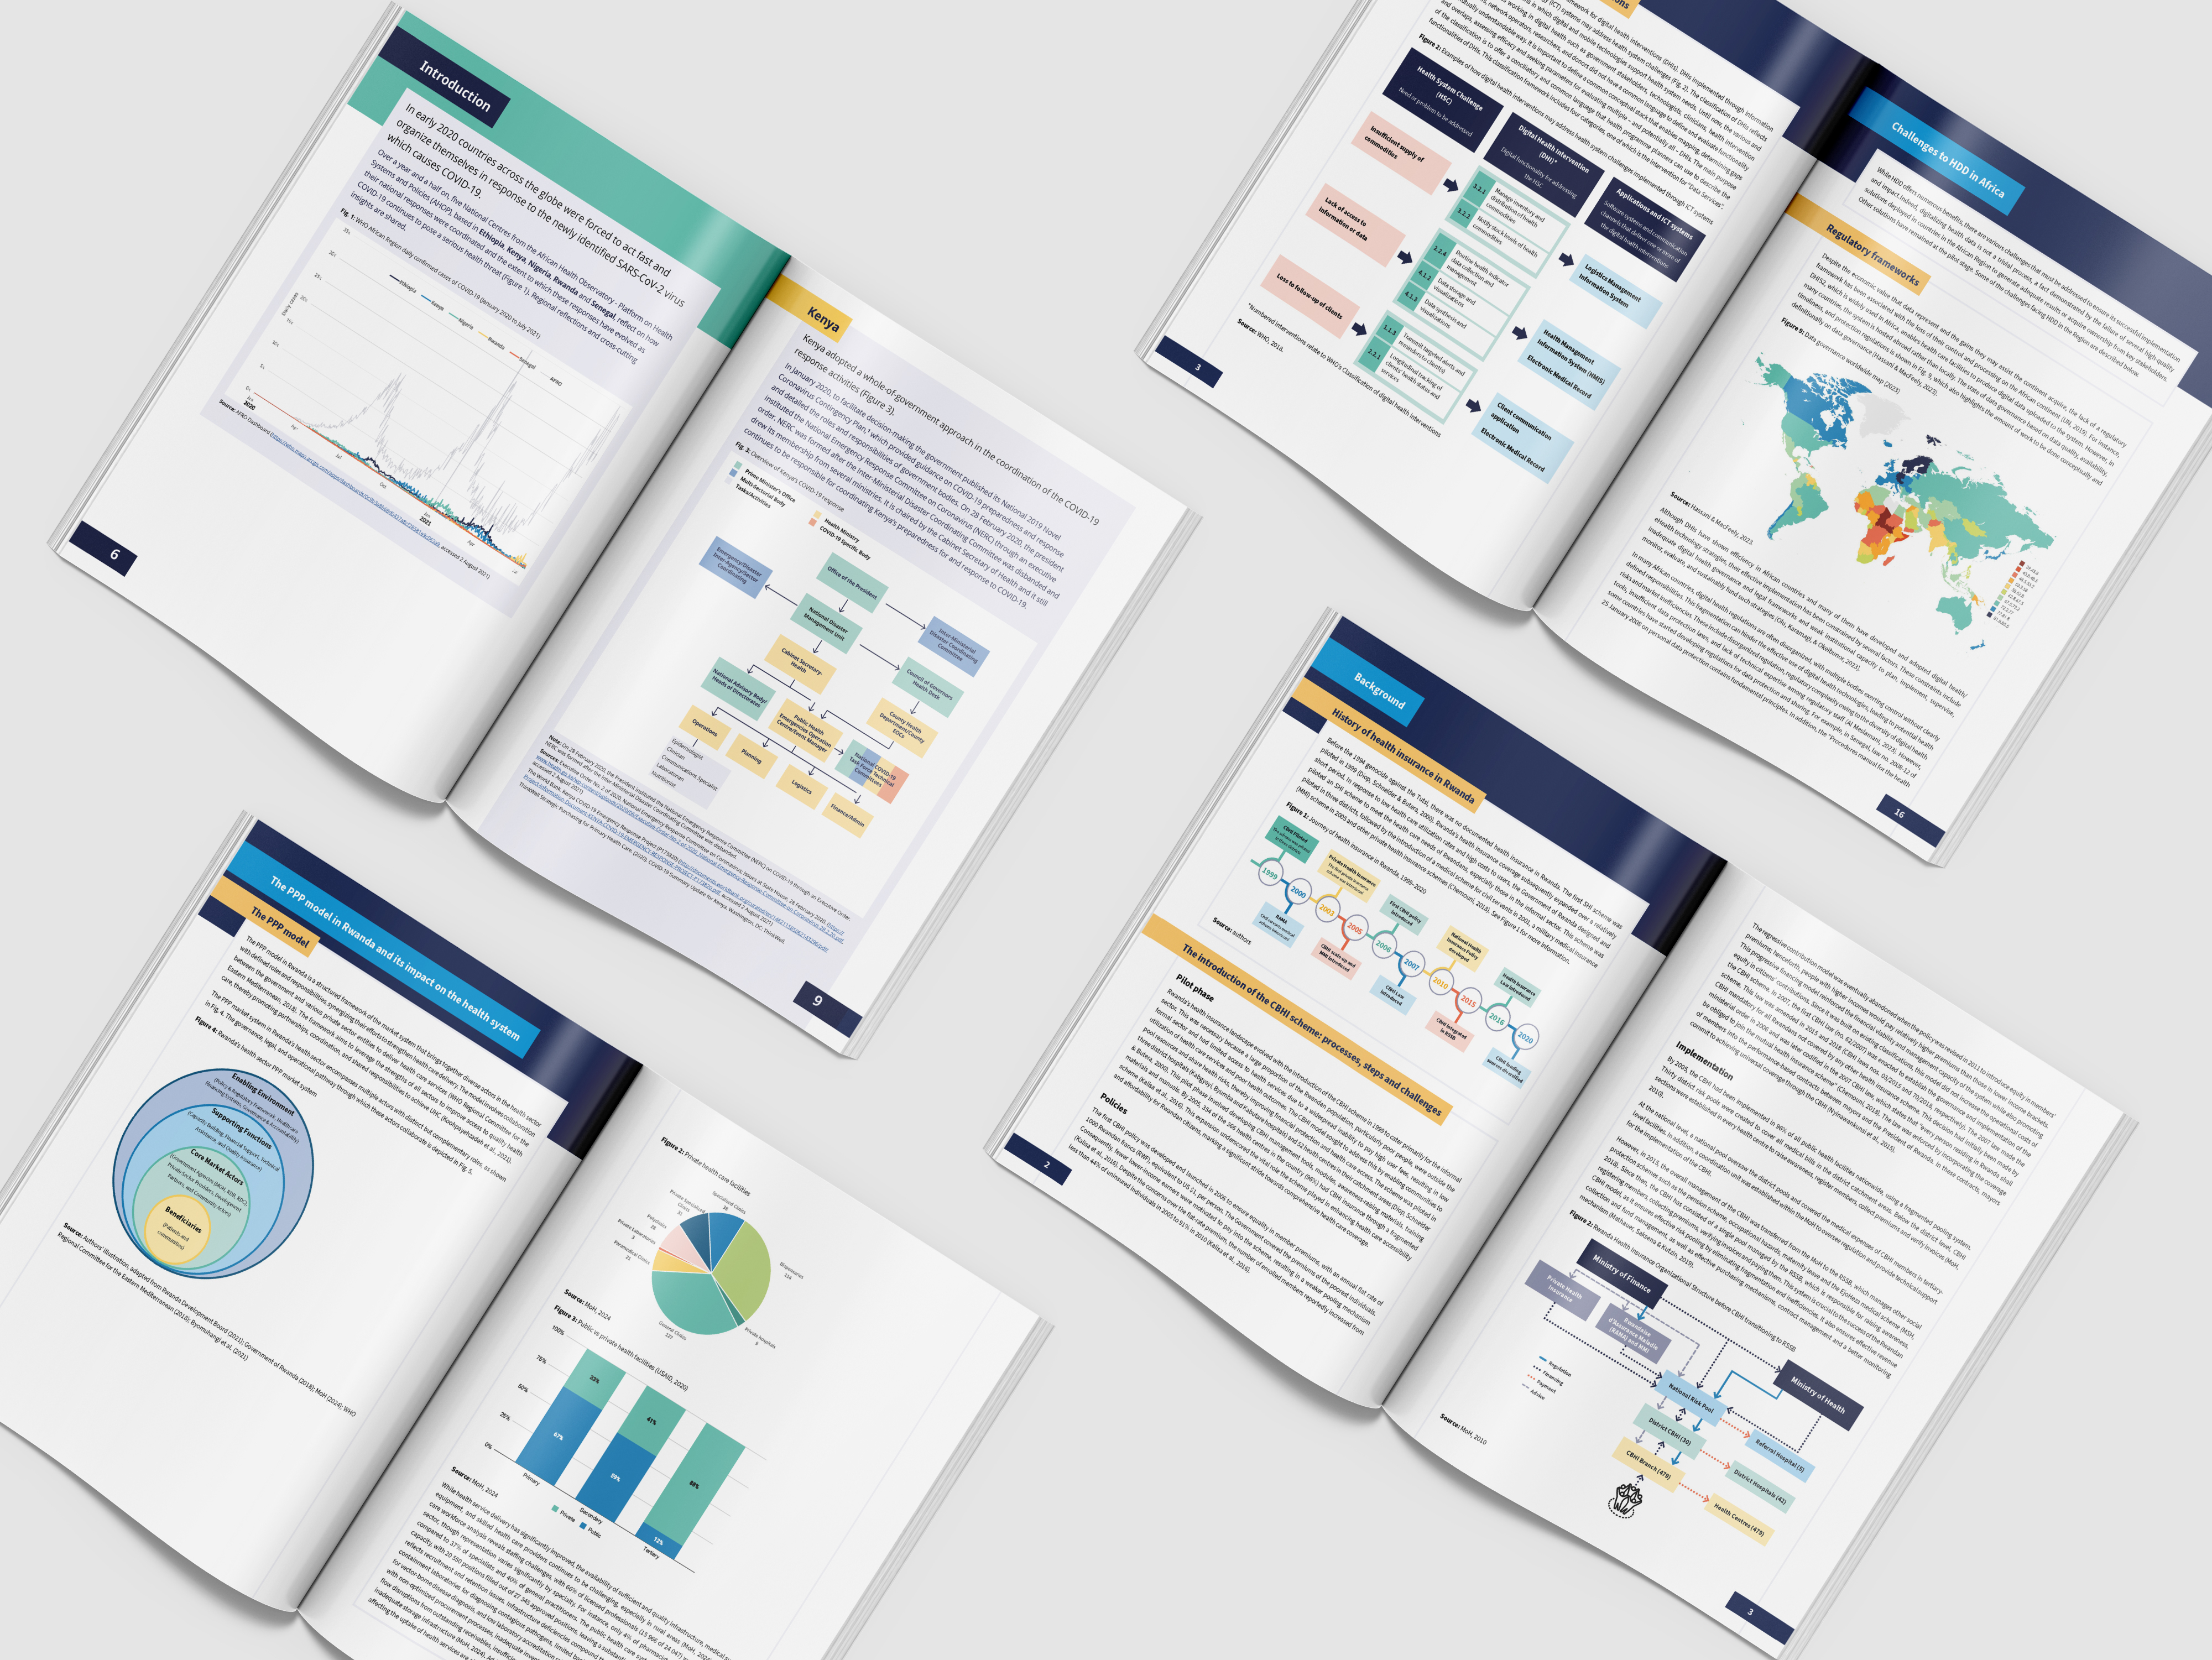
Infographics, charts and maps are an important aspect of the reports and documents, as they break up the text and turn complex data into visual information. Sometimes the supplied graphics would be busy and confusing, so I would break down the content into smaller chunks, allowing myself to make sense of the information and work out how to best present them, so that anyone who wasn't familiar with the data could quickly understand the graphic.
The first step involves laying out the content in the clearest possible way, before aligning the design with other graphics and the document itself through established typography and colours.